pprof:go 的性能调试工具
查一个内存泄漏问题时,使用到了 pprof 工具,在此介绍一下。
简要介绍
pprof 是用于分析 go 程序的工具(分析内存、CPU、mutex、goroutine 等),并提供可视化能力。
使用 pprof 前,需要在代码中引用 "net/http/pprof",并暴露一个端口,下面是示例代码:
1 | // 死循环往一个 map 中加入元素 |
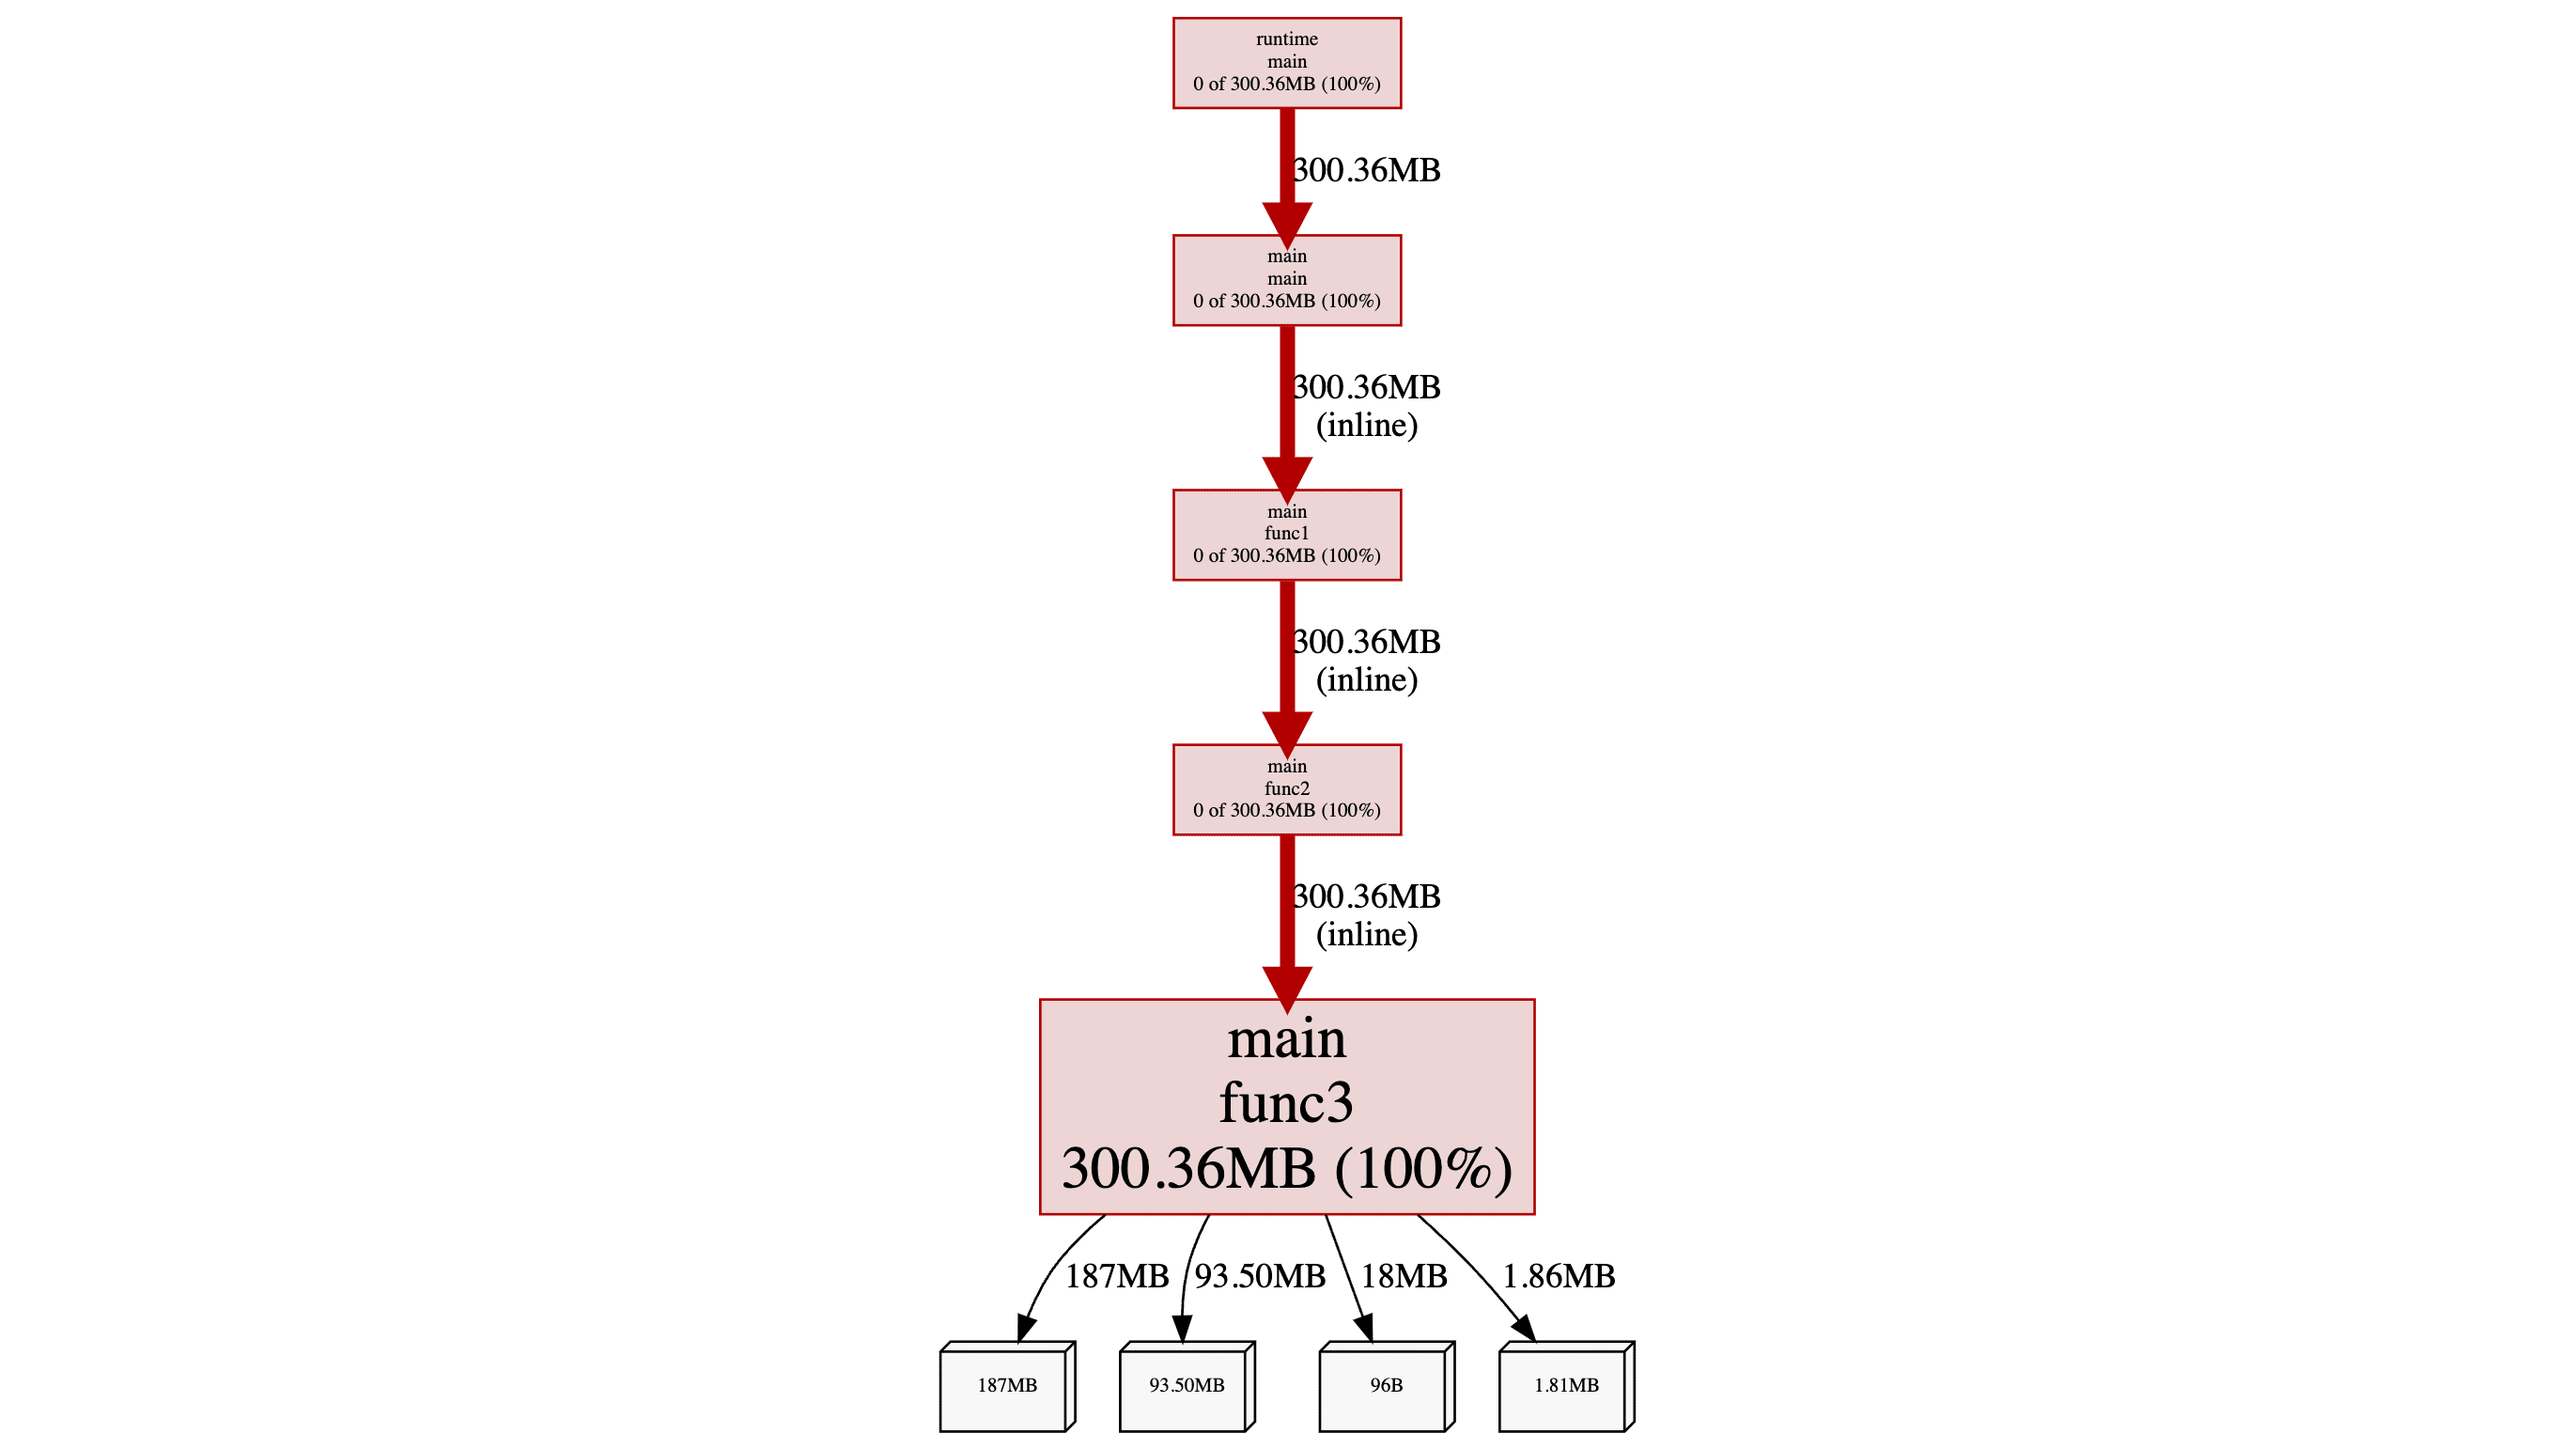
执行程序后,可以通过 go tool pprof 进行分析,查看哪部分代码 CPU 占用高、内存占用高等等。例如下图就是通过 pprof 得到的内存占用情况,可以看出所有内存占用都出自 func3 方法:
上手使用
程序启动后,有两种常用的 pprof 使用方式:
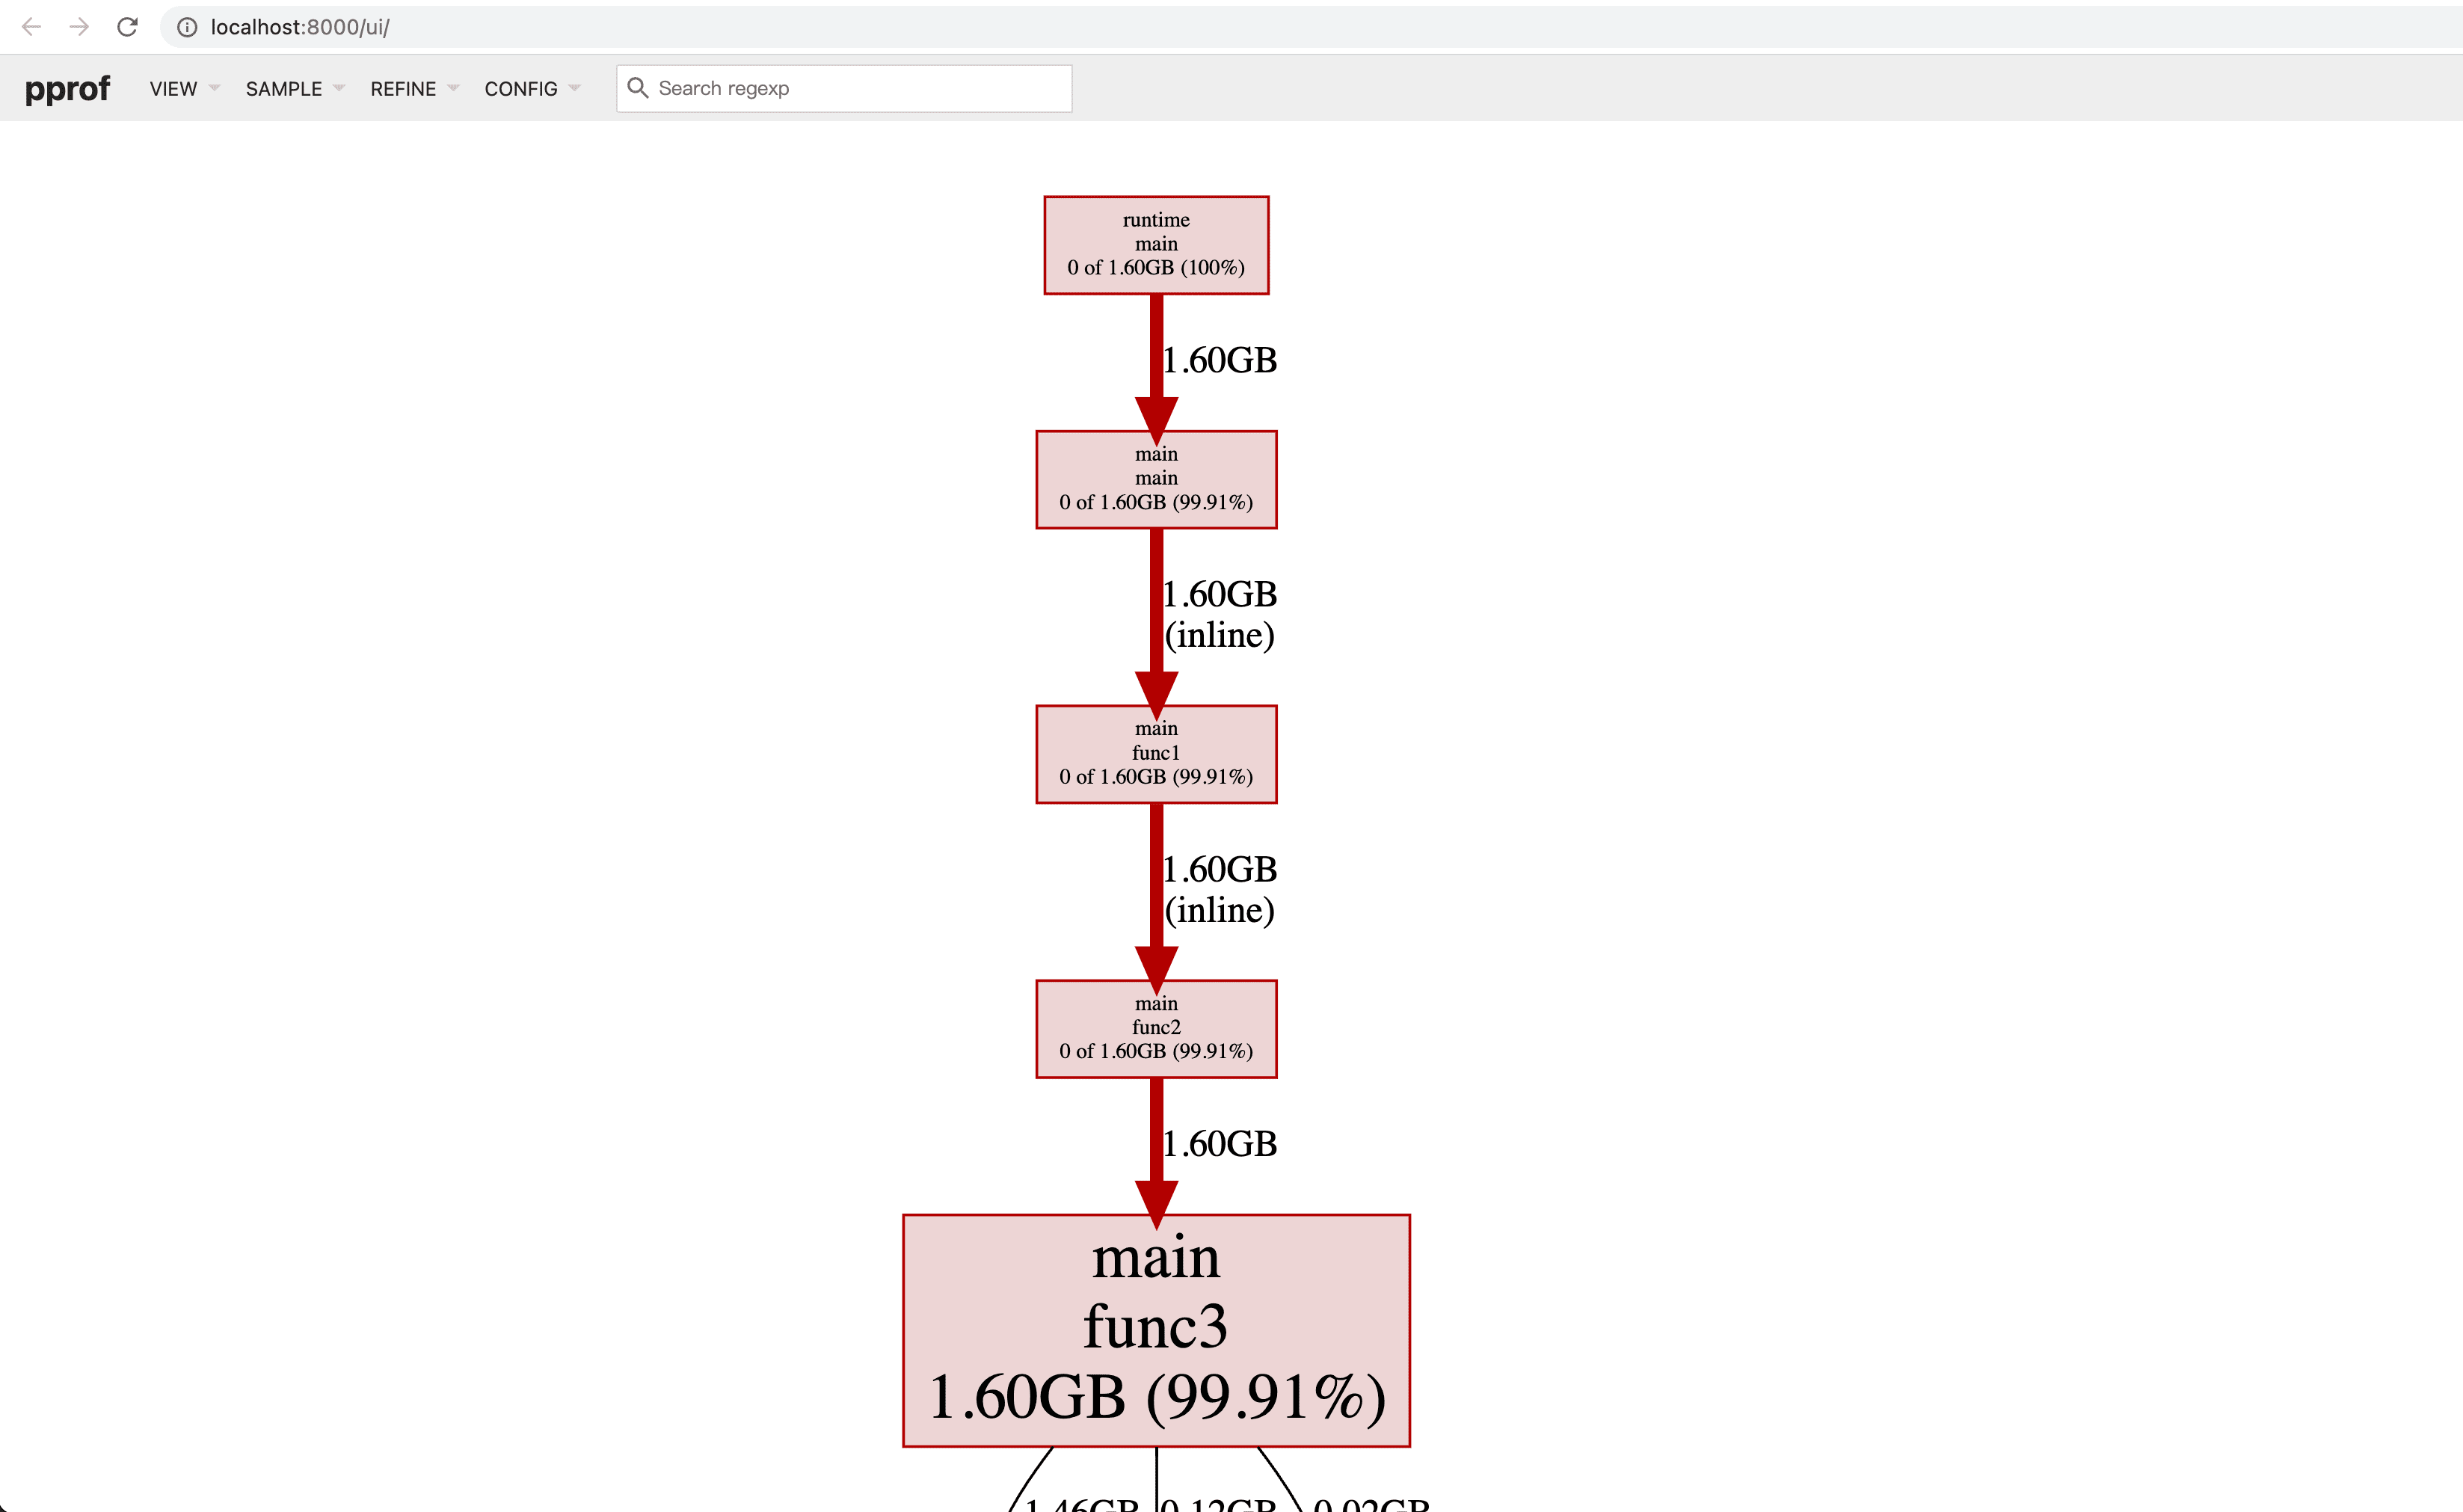
网页操作(需要提前安装好 graphviz)
1
go tool pprof -http=:8000 http://localhost:8080/debug/pprof/heap
执行后会自动跳出浏览器并打开 http://localhost:8000/ui/
交互式命令行操作
1
go tool pprof http://localhost:8080/debug/pprof/heap
执行后会进入到 pprof 的交互模式,之后使用命令行交互
网页操作比较简单,四处点点就明白了,下面主要介绍命令行交互操作。
基本原理
pprof 会把一系列的程序分析样本(profiling samples)打包保存成 proto 文件,并基于这些数据生成文本和图片。
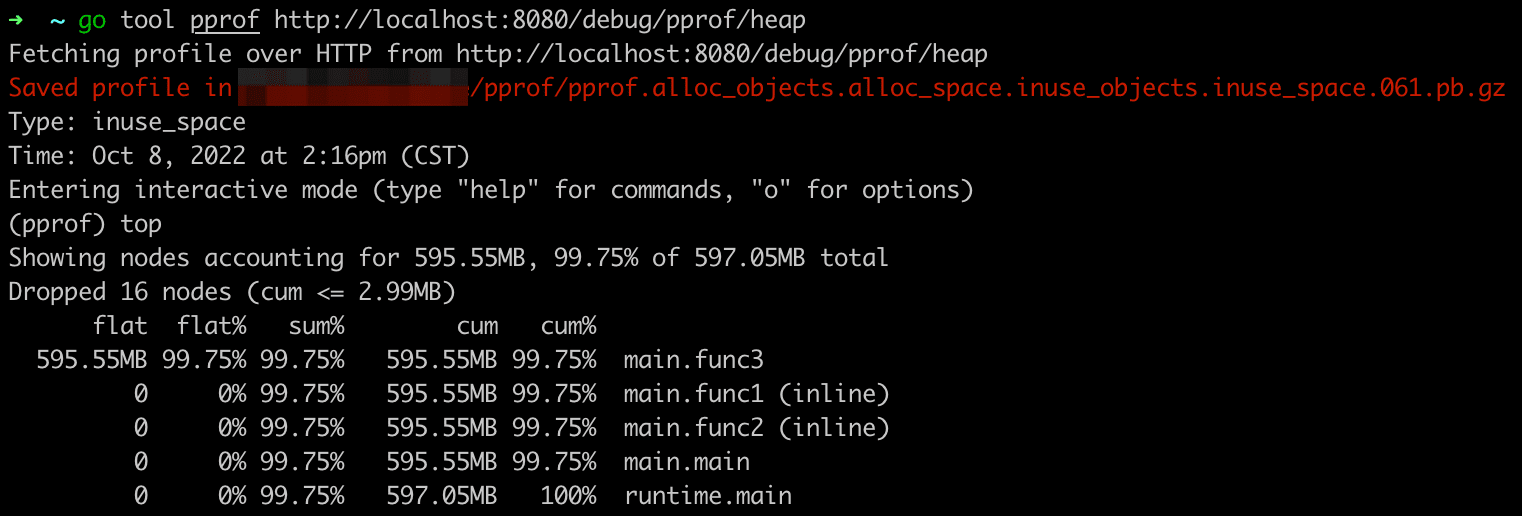
pprof 有自己的命令(pprof [options] source),但是使用起来有点麻烦,我们借助 go tool 来操作 pprof。当我们调用命令 go tool pprof http://localhost:8080/debug/pprof/heap 时,pprof 会首先生成 proto 文件,并让我们进入到命令行交互模式,查看这些数据。
1 | # 输入命令 |
我们在执行 go tool pprof 命令时,使用的 url 地址结尾是 heap,这代表对内存进行采样。除了 heap 之外还有其他一些可选值,例如 allocs(所有曾经分配过的内存)、goroutine(协程数量)、profile(CPU 占用)等等,可自行参考 http://localhost:8080/debug/pprof/ 。
可视化
pprof 通过 graphviz 画图,因此你需要事先安装好 graphviz。安装 graphviz 很简单,基本都是一行命令完事,可以参考官方文档:《graphviz - Download》。
顺便一提,通过交互式命令行也可以生成可视化图片,进入交互模式输入 web 即可(会生成 svg 文件并打开):
1 | (pprof) web |
常用命令
pprof 有非常多命令,你可以在交互模式下输入 help 查看,这里只介绍个人认为常用的命令:
top(查看消耗排前 10 的项)
1
2
3
4
5
6
7
8
9(pprof) top
Showing nodes accounting for 1.16GB, 99.79% of 1.17GB total
Dropped 15 nodes (cum <= 0.01GB)
flat flat% sum% cum cum%
1.16GB 99.79% 99.79% 1.16GB 99.79% main.func3 (inline)
0 0% 99.79% 1.16GB 99.79% main.func1 (inline)
0 0% 99.79% 1.16GB 99.79% main.func2 (inline)
0 0% 99.79% 1.16GB 99.79% main.main
0 0% 99.79% 1.17GB 100% runtime.maintop3(查看消耗排前 N 的项)
1
2
3
4
5
6
7
8(pprof) top3
Showing nodes accounting for 1.16GB, 99.79% of 1.17GB total
Dropped 15 nodes (cum <= 0.01GB)
Showing top 3 nodes out of 5
flat flat% sum% cum cum%
1.16GB 99.79% 99.79% 1.16GB 99.79% main.func3 (inline)
0 0% 99.79% 1.16GB 99.79% main.func1
0 0% 99.79% 1.16GB 99.79% main.func2 (inline)top -cum(累加模式下的 top)
1
2
3
4
5
6
7
8Showing nodes accounting for 1.16GB, 99.79% of 1.17GB total
Dropped 15 nodes (cum <= 0.01GB)
flat flat% sum% cum cum%
0 0% 0% 1.17GB 100% runtime.main
0 0% 0% 1.16GB 99.79% main.func1 (inline)
0 0% 0% 1.16GB 99.79% main.func2 (inline)
1.16GB 99.79% 99.79% 1.16GB 99.79% main.func3 (inline)
0 0% 99.79% 1.16GB 99.79% main.mainlist xxx(显示源代码)
1
2
3
4
5
6
7
8
9
10
11
12(pprof) list func3
Total: 1.17GB
ROUTINE ======================== main.func3 in /Users/pz/Desktop/pz_learn/go_learn/main.go
1.16GB 1.16GB (flat, cum) 99.79% of Total
. . 31:}
. . 32:
. . 33:func func3() {
. . 34: m := make(map[int]bool)
. . 35: for {
1.16GB 1.16GB 36: m[rand.Intn(100000000)] = true
. . 37: }
. . 38:}web(生成 svg 图片并打开)
1
(pprof) web
inline
有时你能在 pprof 的分析中看到 inline,这代表内联,意味着 go 在编译期把这个函数干掉了,插入到调用该函数的地方,从而节省调用函数的开销。
如果你不希望函数内联,可以在函数前面插入 //go:noinline 注释。
以之前的代码为例,我们禁止 func3 函数内联,应该这么写:
1 | package main |
看一下 pprof 的区别:
1 | # 禁用内联前 |
可以看到 main.func3 后面少了 (inline)。
tips
最后加个小 tips:如果程序通过 docker 启动,可以先进到容器里,再执行 go tool pprof ...:
1 | docker exec -it {ContainerID} bash |
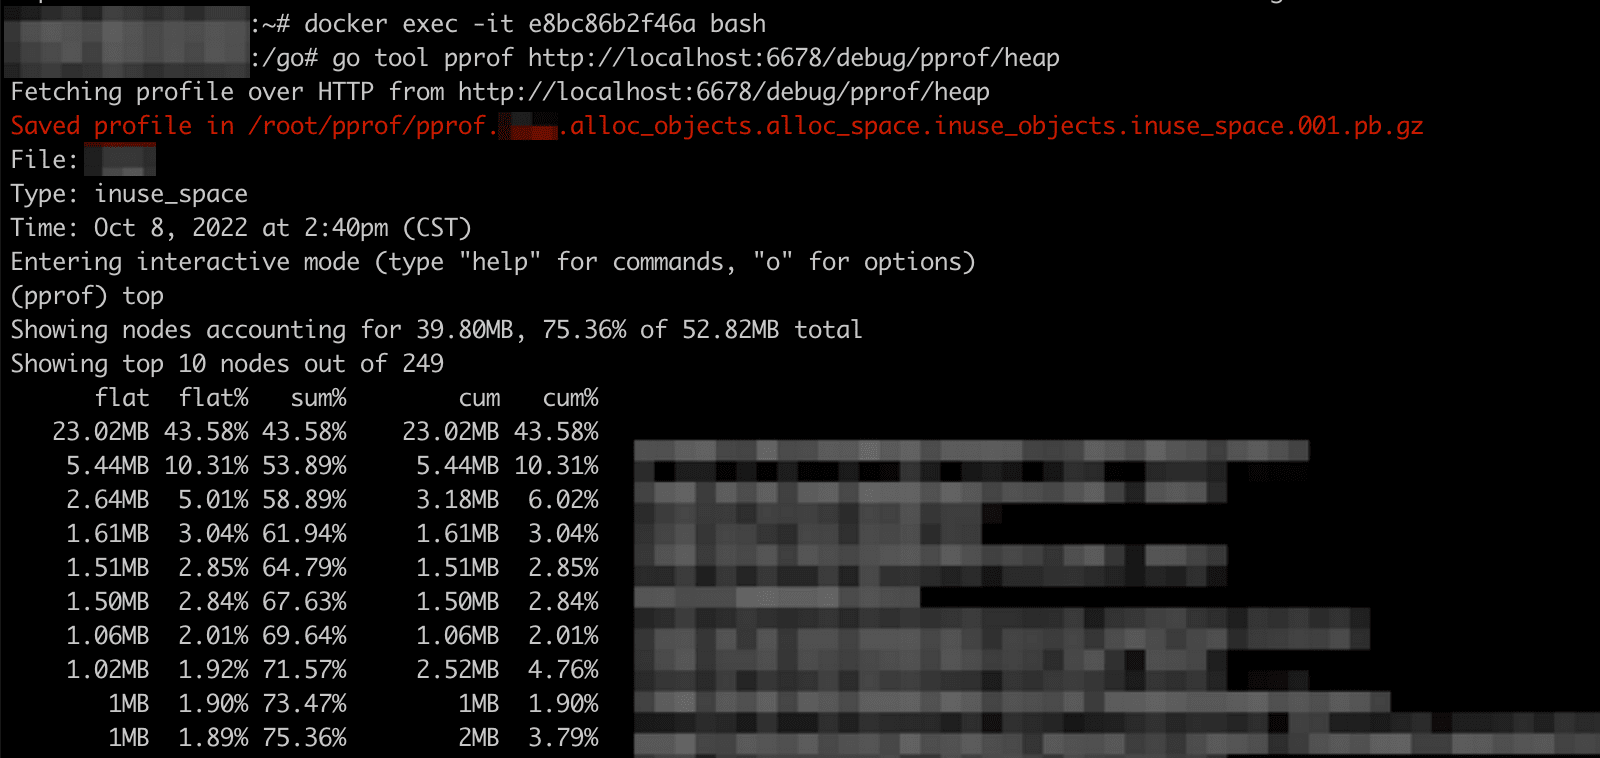
不过因为没有 graphviz,也就这样没办法看图了。
参考文档
- pprof 官方文档:《pprof/README》
- 知乎博文:《实用 go pprof 使用指南》
- go 官方文档:《Profiling Go Programs》